
Build it Locations Dataset | South Africa
Build it is one of South Africa's largest voluntary-trading hardware groups, with a strong footprint in townships and rural towns. This dataset provides a complete, geocoded list of Build it stores with coordinates, addresses, phone numbers and Google popularity signals.
There are 308 locations in this dataset as of 27 July 2026. Compiled and maintained by Vaslap, complete, geocoded and structured for GIS, retail analytics, mapping and AI/RAG workflows.
01 /Geographic distribution
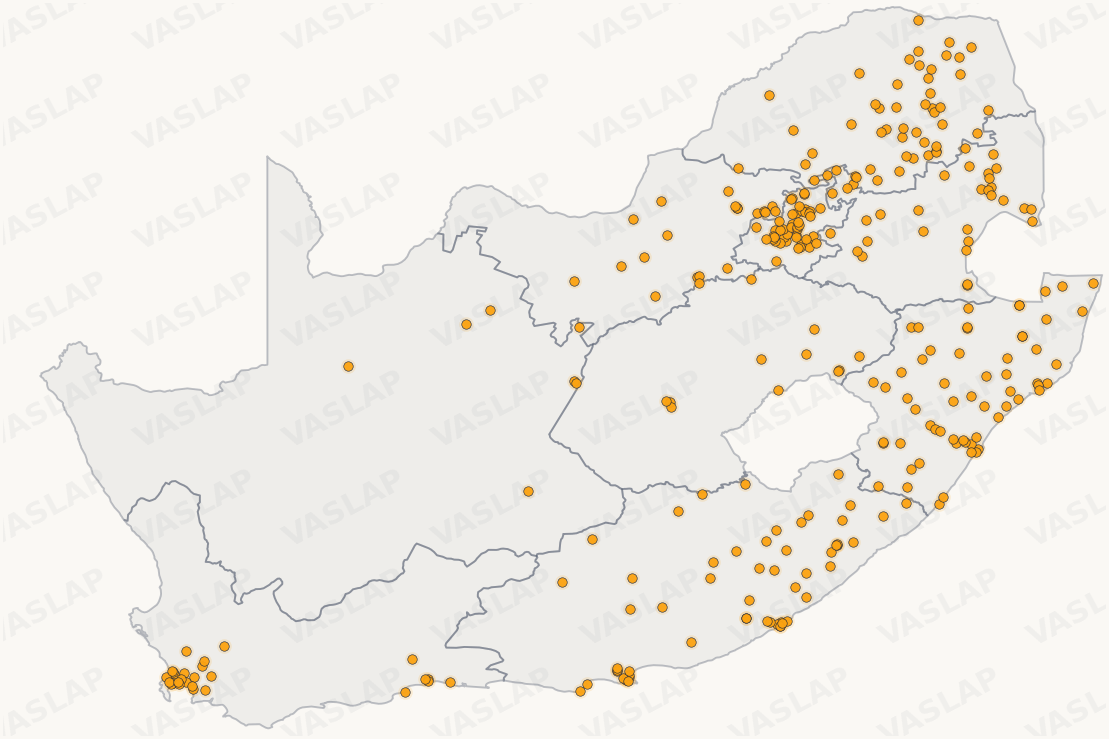
Preview shows true store positions as a static, watermarked image. The purchased CSV contains exact WGS84 coordinates for all 308 locations.
02 /Dataset summary
- Coverage
- 308 locations, South Africa
- Contents
- Coordinates, addresses, provinces, phone numbers, ratings, source URLs
- File format
- Fully geocoded CSV (UTF-8); GeoJSON / Shapefile / Excel on request
- Free sample
- Instant download to verify structure and quality
- Use cases
- GIS, retail analytics, site selection, AI/RAG workflows
- Last updated
- 27 July 2026
03 /Methodology
This dataset is compiled from publicly available business listings using systematic, grid-based collection that covers every province of South Africa, followed by geospatial validation workflows. Automated quality checks and manual analyst reviews are applied to improve coordinate precision, address standardisation, duplicate detection and overall analytical consistency.
Brand attribution is performed by normalising trading names against known retail chain and buying-group identities. Province attribution is derived from each record's verified WGS84 coordinates.
The dataset is periodically reviewed and refreshed to reflect known network changes, new openings, closures and relocations.
04 /Fields included in the CSV
| GUID | Stable unique identifier for each location record |
| Title | Trading name of the store as listed publicly |
| Brand | Detected retail chain or buying group (blank for independents) |
| Category | Business category (e.g. Hardware store, Building materials supplier) |
| Latitude | WGS84 latitude, 7-decimal precision |
| Longitude | WGS84 longitude, 7-decimal precision |
| Address | Street address as published on the public listing |
| Province | South African province, derived from coordinates |
| Phone | Published contact number where available |
| Google Rating | Public review rating (0 to 5) where available |
| Review Count | Number of public reviews where available |
| Google Maps URL | Source listing URL for verification |
| Last Verified | Date the record was last collected and validated |
05 /Data quality scorecard
06 /Data preview
| ID | Title | Latitude | Longitude | Province | Address |
|---|---|---|---|---|---|
| 5a5bb317… | Build it Thulamahashe | -24.722772 | 31.210976 | Mpumalanga | Kumani Rd Thulamahashe Mall |
| 7b466f4f… | Build it Mkhuhlu | -24.965350 | 31.248300 | Mpumalanga | R536 Stand 59 |
| 21ff6833… | Build it Hoedspruit | -24.350779 | 30.951807 | Limpopo | 52 Buffel St |
| e69f3799… | Build it Hazyview | -25.044736 | 31.127059 | Mpumalanga | Shop 7, Kai Centre, 1108 Arend Way |
| 841840dd… | Buildit | -24.609395 | 30.775939 | Mpumalanga | |
| 31dc272c… | Build it Sifunindlela | -25.302402 | 31.169667 | Mpumalanga | Stand, 5630, Main Rd |
| ccc1b152… | Build it Mahushu | -25.133087 | 31.137854 | Mpumalanga | Midway Centre, Numbi Gate Rd Numbi |
| 93310c5b… | Build it Graskop | -24.934359 | 30.840858 | Mpumalanga | 10 Main St |
Only a subset of fields is displayed here. Download the free sample to view all fields and verify the structure.
07 /Provincial distribution
Brand bundle: R999
All major chains in one standardised dataset. Best for competitive benchmarking and market sizing.
View bundle →Full market coverage
Everything in the bundle plus independent stores and smaller chains. Best for full-market mapping and whitespace analysis.
View full POI dataset →08 /Who uses this data
Site selection & network planning
Identify under-served towns and whitespace across this brand network. Outcome: smarter expansion
Competitive benchmarking
Compare store footprints, regional density and market presence. Outcome: no blind spots
B2B sales & telemarketing
Pitch POS, insurance, cleaning, security and logistics to verified store contacts. Outcome: bigger pipeline
CRM enrichment
Append standardised coordinates and contact details to Salesforce or HubSpot records. Outcome: cleaner data
Trade-area & mobility analysis
Evaluate retail proximity to transport corridors and residential growth nodes. Outcome: defensible catchments
Geofencing & local advertising
Build hyper-local campaigns around store catchments. Outcome: sharper targeting
09 /Frequently asked questions
What file format is included with the download?
The dataset is delivered as a UTF-8 CSV file compatible with Excel, Python, R, QGIS, Power BI, Tableau and PostgreSQL, as well as most GIS and analytics platforms. GeoJSON, Shapefile and Excel delivery are available on request.
How accurate are the coordinates?
Every record carries WGS84 coordinates captured from the source listing and passed through automated validation and manual quality review. Coordinates are suitable for mapping, territory planning and drive-time analysis.
Is the dataset standardised for analytics workflows?
Yes. Field naming, address formatting, brand attribution and province tagging are standardised so the file drops cleanly into BI tools, GIS software and data pipelines without cleaning.
Can this dataset support expansion planning?
Yes. Analysts use it to identify under-served areas, evaluate regional density and benchmark candidate sites against existing store networks.
How often is the data updated?
This dataset was last refreshed on 2026-07-27 and is reviewed on a quarterly cycle. Purchases include the current snapshot; refresh subscriptions are available on request.
Can I get the data for a different industry or region?
Yes. Vaslap builds custom datasets on request, any retail category, brand set or region of South Africa. Use the custom-dataset form and we will scope it with you.
10 /Analyse this data with AI
Use these prompts with ChatGPT, Claude or Gemini once you have the CSV:
“Analyse this Build it Locations dataset to identify under-served provinces in South Africa for potential market expansion.”
“Assess how effectively the current store network in this Build it Locations dataset covers major commercial and residential hubs.”
“Rank South African towns by hardware retail saturation using this dataset and highlight the top 10 whitespace opportunities.”
Disclaimer: All brand names and trademarks are the property of their respective owners and are used strictly for identification purposes. This product consists of geospatial location data compiled from public sources; no logos, images or trademark rights are included.